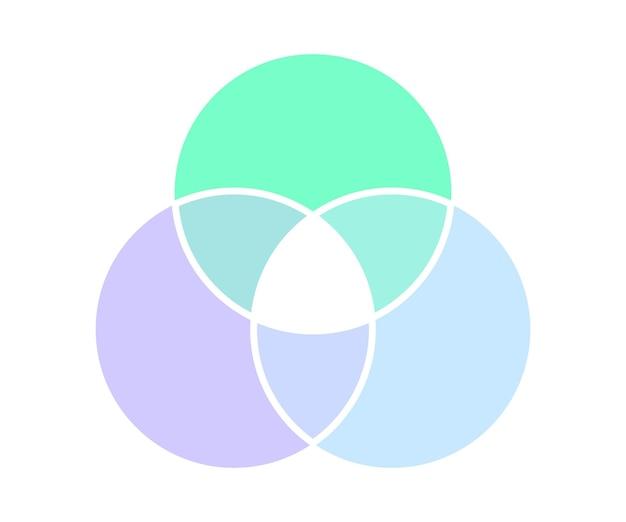
Are you looking for a simple and effective way to compare and contrast different sets of data or ideas? Look no further than a Venn diagram! Venn diagrams are powerful tools that can help you visually represent overlapping concepts or elements. Whether you’re a student, a professional, or just someone who wants to organize information in a clear and concise manner, learning how to create a Venn diagram is a valuable skill.
In this blog post, we will explore how to make a Venn diagram using Apple’s Pages, a popular word processing and page layout software for Mac. We will also delve into other alternatives like Google Slides and Google Docs for your diagramming needs. So, grab your Mac or iPad, and let’s dive in to discover how to craft your own Venn diagram and make your information pop!
How to Create a Venn Diagram on Pages
If you’re tired of using plain old text to explain overlapping concepts, it’s time to spice things up with a Venn diagram. These visual representations are a fantastic way to showcase the similarities and differences between different groups or ideas. In this guide, we’ll show you how to create a Venn diagram on Pages, Apple’s versatile word processing software. So grab a cup of coffee and let’s dive in!
Setting the Stage
Before we jump into the nitty-gritty of making a Venn diagram, make sure you have Pages open and ready to go. We’ll be using the latest version of Pages (2023), packed with new features and a shiny interface. If you haven’t updated yet, don’t worry, the steps should still be similar.
Step 1: Starting with Shapes
To kick-start your Venn diagram journey, head over to the “Shapes” button in the toolbar. This is where the magic happens! Click on it, and a drop-down menu of shapes will appear, not unlike a magician pulling a rabbit out of a hat. Among the array of shapes, you’ll find the perfect foundation for your Venn diagram—a circle!
Step 2: Onwards to Overlapping
Now that you have the circle in your grasp, it’s time to duplicate it. Hold down the “Option” key (or “Alt” key for the Windows folks) and drag the circle to create a copy. Place the duplicate circle overlapping the first one, just like two old friends catching up for tea. Voila! You have your first overlapping region.
Step 3: A Third Circle Appears
Do you feel that one overlapping region isn’t enough? Don’t worry, we’ve got you covered. Repeat Step 2 to create a third circle, and position it so that it overlaps with the first two circles. Now, take a moment to appreciate the beauty of three circles harmoniously intermingling—it’s like a ballroom dance of shapes!
Step 4: Adding Text
A Venn diagram without labels is like a cake without sprinkles—sad and incomplete. Right-click (or tap and hold) on each circle, select “Add Text,” and unleash your inner Shakespeare. Type in the appropriate text to represent each group or concept. You can have as many labels as your heart desires!
Step 5: Styling and Customizing
Once you’ve labeled your circles, it’s time to add your personal touch. Explore the Text Style and Shape Style options to make your diagram stand out. Choose from a plethora of fonts and colors, and don’t be afraid to unleash your creativity. Remember, your Venn diagram is your canvas!
Step 6: Group Hug!
With your diagram complete and looking dapper, it’s time to give it a group hug. Select all the circles by holding down the “Shift” key and clicking on each one. Now, go to the Arrange menu and select Group. Congrats, your diagram is now one happy family.
Step 7: Sharing is Caring
Your Venn diagram masterpiece is ready to be shared with the world! Go to the File menu and choose Export To. You have a range of options, from saving it as a PDF for easy printing to exporting it as an image to be shared on social media. Choose the format that best suits your needs, and let your creation roam free!
And there you have it—your very own Venn diagram created with Pages in a breeze. Feel free to experiment, embellish, and amaze your friends and colleagues. Remember, the world is your canvas, and Venn diagrams are your artistic medium. Happy diagramming!
Frequently Asked Questions (FAQ): How To Make a Venn Diagram on Pages
Can I create a diagram in Pages
Yes, absolutely! Apple’s Pages, the popular word processing and layout application, includes built-in tools that allow you to create various types of diagrams, including Venn diagrams. It’s a breeze to bring your ideas to life with Pages. Let me show you how!
Is there a built-in Venn diagram feature in Google Slides
While Google Slides offers an array of powerful features, unfortunately, it does not currently have a dedicated Venn diagram tool. However, don’t fret! By using some creative techniques and the available shapes and text tools in Google Slides, you can still create your own Venn diagram.
How can I use a Venn diagram to compare and contrast
Using a Venn diagram is an excellent way to visually compare and contrast items or ideas. Here’s how you can do it:
- Identify the common and distinct qualities or attributes of the items or ideas you want to compare.
- Draw two or more overlapping circles on a piece of paper or using a diagram software.
- Label each circle with the items or ideas you are comparing.
- Write down the common qualities in the overlapping area of the circles, and the distinct qualities in the separate areas.
What program can I use to make a Venn diagram
There are several programs, both online and offline, that you can use to create a Venn diagram, depending on your preferences and needs. Some popular options include Microsoft Word, Google Docs, and specialized diagramming software like Lucidchart or Creately. Choose the one that suits your requirements and get creative!
How do I make a Google document landscape
To change the orientation of your Google document to landscape mode, follow these simple steps:
- Open your Google document.
- Click on “File” in the top-left corner.
- Choose “Page setup” from the drop-down menu.
- In the “Page setup” window, select “Landscape” under the “Orientation” section.
- Click on the “OK” button to apply the changes. Voila! Your Google document is now in landscape mode.
How do I create a bubble diagram on Google Docs
Creating a bubble diagram in Google Docs is not as straightforward as creating a Venn diagram. However, you can still achieve a similar effect with a little creativity. Follow these steps:
- Open your Google document.
- Insert a table with the desired number of rows and columns.
- In each table cell, insert a shape (e.g., a circle or oval) using the “Insert” menu and selecting “Drawing.”
- Customize each shape’s size, color, and position to create a bubble-like appearance.
- Label each bubble with the relevant text, arranging them to visualize your ideas effectively.
How do I make a Venn diagram on Google Docs on iPad
Creating a Venn diagram on Google Docs on your iPad is easy peasy! Here’s how you can do it:
- Open the Google Docs app on your iPad and create a new document or open an existing one.
- Tap on the “+” button at the top-right corner of the screen.
- Select “Drawing” from the options that appear.
- In the drawing canvas, tap on the “Shape” icon and choose the circle or oval shape.
- Draw two or more overlapping circles on the canvas to create your Venn diagram.
- Customize the circles’ appearance, add text, and arrange them as needed.
- Tap on the “Save and close” button to insert the diagram into your Google Doc.
How do I draw on Pages on a Mac
Drawing on Pages is a fun and creative way to enhance your documents. Here’s how you can unleash your inner artist on Pages:
- Open your Pages document on your Mac.
- Click on the “Shapes” button in the toolbar at the top of the screen.
- Choose a drawing tool from the drop-down menu, such as the pen, pencil, or brush.
- Use your mouse or trackpad to draw or sketch directly on the document canvas.
- Customize the color, thickness, and style of your drawings using the options in the formatting toolbar.
- Let your imagination run wild and create stunning visual elements in your Pages document.
How can I create a Venn diagram in Tableau
Tableau, a powerful data visualization software, provides a seamless way to create Venn diagrams. Follow these steps to craft a captivating Venn diagram in Tableau:
- Connect your data source to Tableau.
- Drag the required dimensions onto the “Columns” and “Rows” shelves.
- In the “Marks” card, choose “Circle” as the mark type.
- Drag a dimension onto the “Filters” shelf to define the overlap criteria between circles.
- Adjust the size, color, and other visual properties of the circles to suit your preferences.
- Add appropriate labels and titles to provide context and enhance understanding.
- Enjoy the beauty of your professionally crafted Venn diagram within Tableau!
How do I make a Venn diagram on a laptop
Creating a Venn diagram on your laptop is a breeze, especially if you have access to a diagramming or design software. Here’s a general guide to help you create a Venn diagram on your laptop:
- Open your preferred diagramming software or launch an online tool.
- Select the Venn diagram template or the option to create a new diagram.
- Designate the number of circles you want to include in your diagram.
- Arrange the circles in an overlapping configuration.
- Customize each circle’s size, color, and labels.
- Add text or other visual elements within the overlapping areas to highlight commonalities.
- Once you’re satisfied with the result, save your diagram and incorporate it into your project or presentation.
How do I make a diagram on a Mac
On a Mac, you have the advantage of using Apple’s own productivity suite, which includes Pages, Numbers, and Keynote. To create a diagram on your Mac, follow these steps using Pages:
- Open Pages on your Mac.
- Create a new document or open an existing one.
- Click on the “Shapes” button in the toolbar, which resembles a square and a circle.
- Choose the desired shape, such as a rectangle, circle, triangle, or arrow.
- Click and drag on the canvas to create the shape.
- Customize the shape’s color, size, and other properties using the formatting options in the toolbar.
- Add labels, text, or additional shapes to complete your diagram.
How do I make a Venn diagram online
Creating a Venn diagram online is a breeze with the plethora of available web-based diagramming tools. Here’s a simple guide to help you make a Venn diagram online:
- Open your preferred web-based diagramming tool (e.g., Lucidchart, Creately, or draw.io).
- Start a new blank canvas or select a Venn diagram template.
- Customize the number of circles and the desired arrangement.
- Adjust the size and position of the circles as needed.
- Label each circle with the appropriate text.
- Add meaningful overlaps or intersections to visualize common elements or relationships.
- Customize the colors, fonts, and other visual aspects to make your Venn diagram visually appealing.
- Save or export your diagram to share or incorporate it into your documents or presentations.
How do I make a Venn diagram in Excel with data
Excel, the trusty spreadsheet software, can also be used to create Venn diagrams. Here’s how you can do it:
- Open Microsoft Excel and enter your data.
- Select the data you want to use for your Venn diagram.
- Click on the “Insert” tab in the Excel toolbar.
- In the “Charts” group, click on the “Insert Scatter (X, Y) or Bubble Chart” button.
- Select the “Bubble” chart type.
- Excel will generate a basic Venn diagram using your selected data.
- Customize the chart’s appearance by adjusting colors, labels, and other formatting options.
- Add a suitable title to your Venn diagram to provide context and clarity.
Can Excel create Venn diagrams
While Excel’s primary purpose is to analyze and manipulate data, it does offer basic charting and graphing capabilities. Through clever data manipulation and creative charting techniques, you can create Venn diagrams in Excel. However, keep in mind that specialized diagramming software or tools may provide more intuitive and flexible options for creating Venn diagrams.
How do I make a chart on Google Docs
Creating charts in Google Docs is a terrific way to visualize and present your data effectively. Follow these steps to make a chart:
- Open your Google document and go to the page where you want to insert the chart.
- Click on the “Insert” menu in the top toolbar.
- Select “Chart” from the drop-down menu.
- Choose the chart type that suits your data and visualization needs.
- A spreadsheet will open with sample data. Replace the sample data with your own.
- Customize the chart’s appearance, labels, colors, and other settings.
- Once you’re satisfied with the chart, click on “Insert” to add it to your document.
- Feel free to resize or reposition the chart as needed to fit your layout.
How do I make a Venn diagram with data
Creating a Venn diagram with data is all about identifying overlapping values or relationships. Follow these steps to make a Venn diagram using your data:
- Identify the categories or groups you want to compare and find commonalities within them.
- Collect or gather the data pertaining to each category or group.
- Use a diagramming or charting software, such as Microsoft Word, Google Docs, or specialized online tools, to create a Venn diagram.
- Represent each category or group with a separate circle or shape.
- Place the overlapping sections within the circles to indicate common elements or relationships.
- Add labels, titles, and other text to enhance understanding.
- Customize the appearance of the diagram to make it visually appealing and easy to comprehend.
- Incorporate your data into the diagram to provide a comprehensive and insightful visualization.
How do I make a diagram on Microsoft Word
Microsoft Word, a popular word processing software, offers a range of features to create diagrams. Here’s how you can make a diagram in Microsoft Word:
- Open Microsoft Word on your computer.
- Click on the “Insert” tab in the toolbar.
- In the “Illustrations” group, click on the “Shapes” button.
- Choose the shape or combination of shapes that best suits your diagram.
- Click and drag on the document canvas to create the shape(s).
- Customize the shape’s appearance by right-clicking on it and selecting “Format Shape.”
- Adjust the color, size, border, and other properties to match your desired look.
- Add labels, text, or additional shapes to complete your diagram.
- Save and share your document with your visually stunning diagram!
How do I make a Venn diagram on Google Docs
While Google Docs doesn’t have a built-in Venn diagram feature, you can still create one with a bit of ingenuity. Follow these steps to make a DIY Venn diagram on Google Docs:
- Open your Google document.
- Click on the “Insert” menu in the top toolbar.
- Hover over “Drawing” and select “New” to open the drawing canvas.
- Use the available shapes, lines, and text tools to create your Venn diagram manually.
- Arrange circles and text boxes to represent the different areas and labels of the diagram.
- Customize the appearance of your Venn diagram using the formatting options.
- Once you’re satisfied with the result, click on the “Save and Close” button.
- The drawing will be inserted into your Google document, and you can position and resize it as needed.
Feel free to unleash your creativity and design a stunning Venn diagram using the versatile tools within Google Docs!